
Ever since yesterday when I heard the news of it being 8 Billion Day, I've periodically checked in on WorldOMeter's website. It shows the current population numbers in live time, with numbers changing by the second. It's amazing to see the incredible jump from this time today versus the same time yesterday!
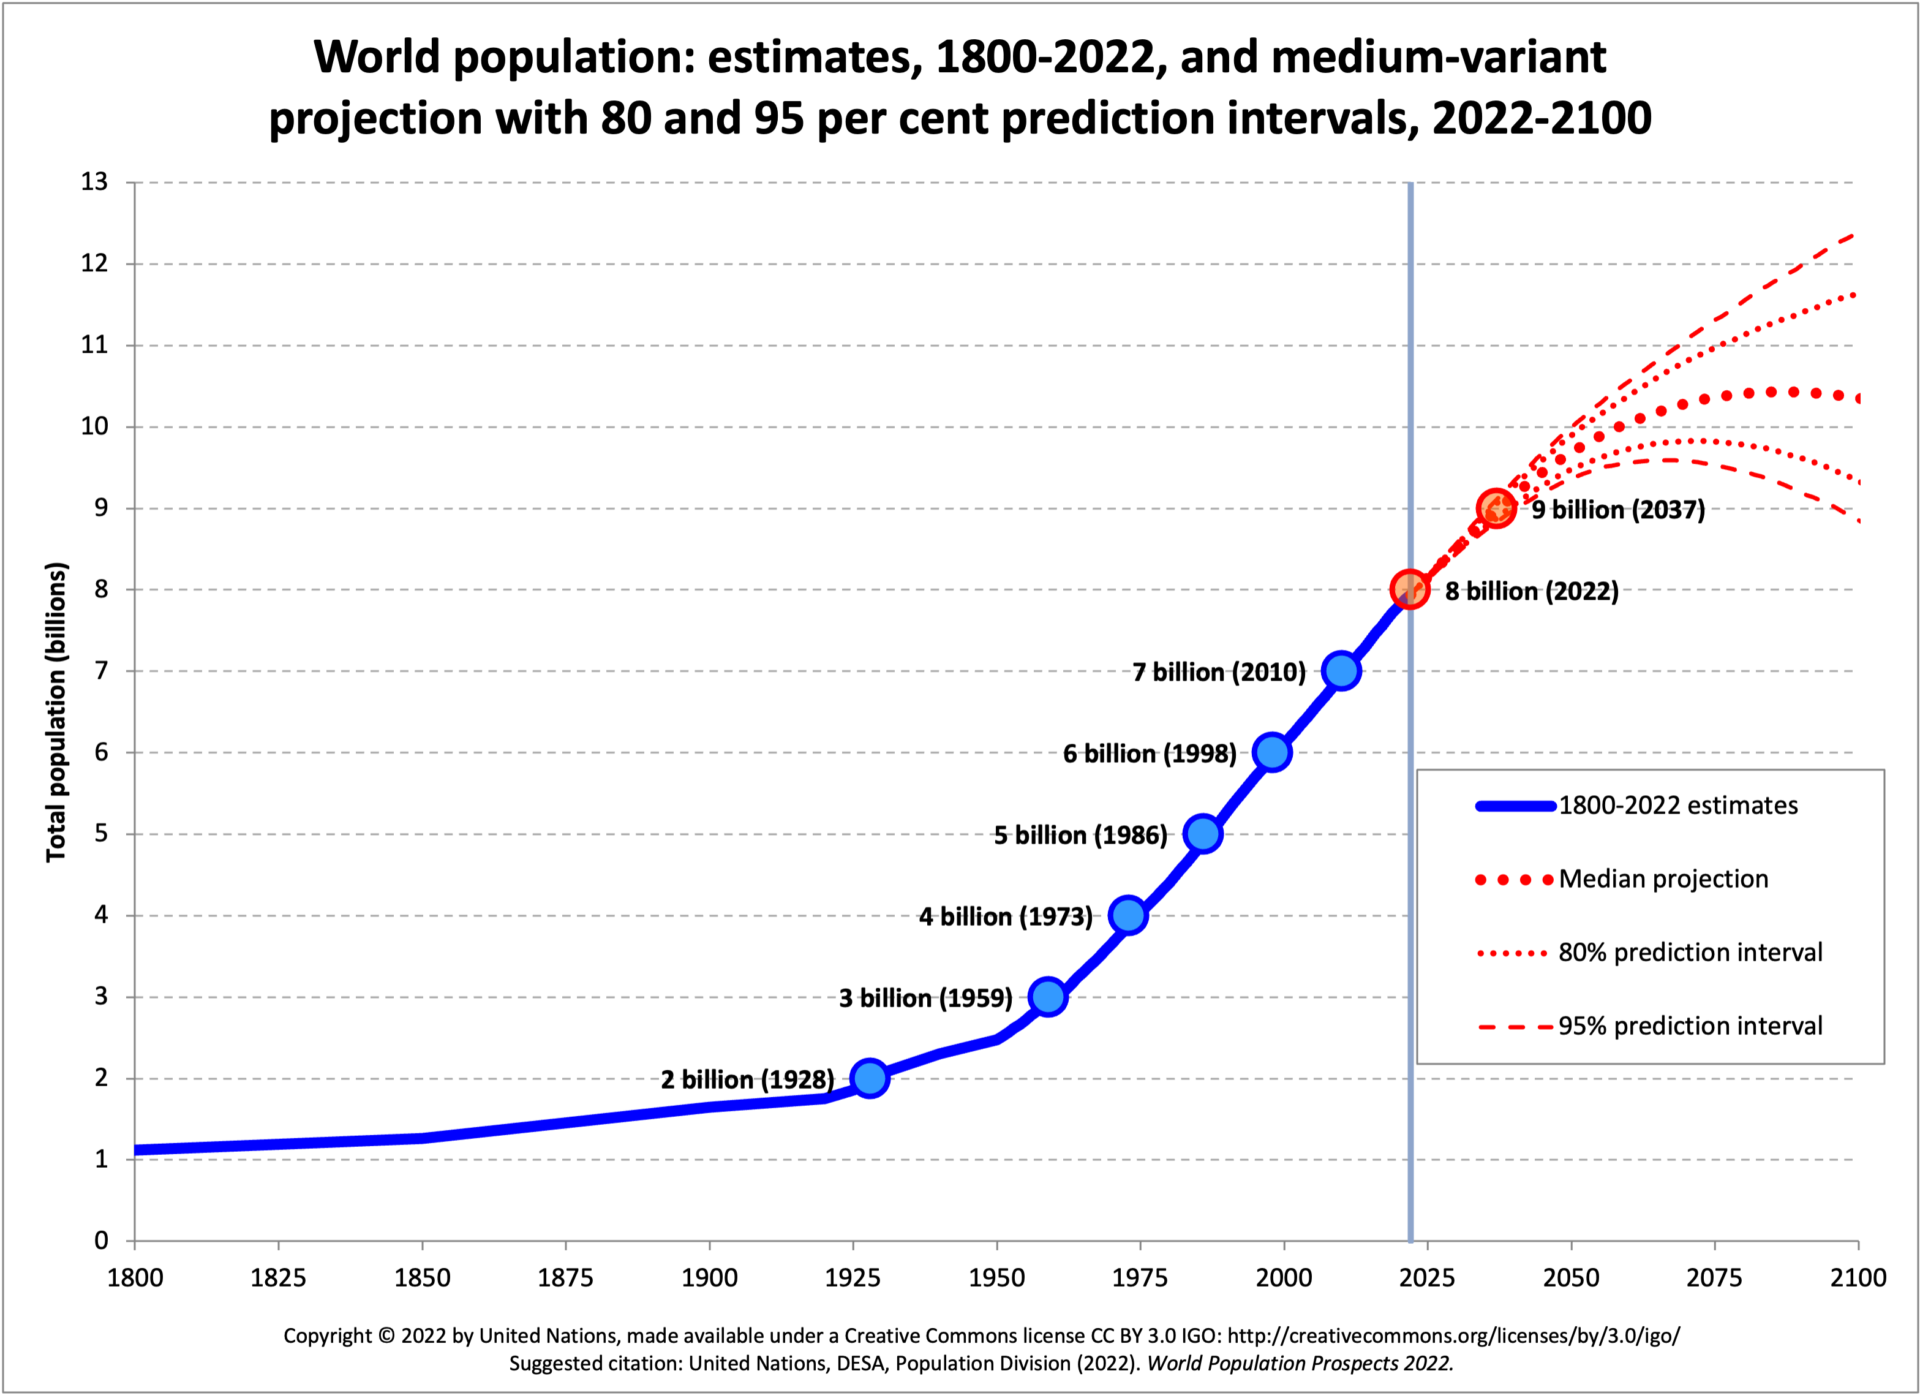
Watching the trajectory historically as we gain each additional billion is fascinating. The graph below--as well as the data in the chart I made--were from Population Education's website and their post by Marian Starkey [July 6, 2022] entitled "8 Billion and Growing: World Population Milestones Throughout History." Both data visualizations are eye-opening and jaw-dropping when you think of how that rate has increased over time. The startling point too is how flat the line on the graph was for population growth from year 0 to 1800 (which you can see on the graph shown here).


While it's looking like United Nation projections don't have us hitting 9 million until 2037 (15 years, a bit of a bigger jump than what we just saw between 7 and 8 billion), there clearly are ramifications across almost every field of study and interest. Of course, there are the environmental impacts of an ever-crowding planet. Technology and medicine have made it possible to have fuller, richer, healthier, and longer lives. Growing population means we need to have the resources available for us to live here on our planet as well as to provide us with food for all of these growing people.
To learn more about the Day of 8 Billion and how 8 billion people impact our planet, check out these sites:
- "How Big Is a Billion" benchmarks from Population Education so you can begin to wrap your head around just how big IS 8 billion??!
- Click this GTG archived link from back in February of 2015 (way back when there were only 7.3 billion people) to see Population Education's 7 minute map-animated video of population over time from 0 to current day and projected to 2050
- Also from February 2015 and my "Framing Education Around Population" post about Population Education, find the map of what countries would look like if their land mass matched their population.
- Population education's "Day of 8 Billion – 9 Interesting Population Questions and Answers"
- Pam Wasserman's August 2022 Population Education blog post entitled "8 Billion People on the Planet by November… and 13 Other Takeaways from the 2022 UN World Population Prospects"
- Population Education's "Teaching in a World of 8 Billion" for class simulations, lesson plans, and other resources.
- Population Riddles you can use in class with to get your students math minds bending around these really big numbers.
- Counting Populations: Millions & Billions, a population unit for K-5 students.
Intro image from https://thelatch.com.au/current-world-population/, Population graph from https://populationconnection.org/wp-content/uploads/2022/07/1800-2100.png; chart created from data on https://populationconnection.org/blog/world-population-milestones-throughout-history/, video from https://www.youtube.com/watch?v=6vL1_kCX6qg


No comments :
Post a Comment